
Experimental comparison of measurement techniques for drop size distributions in liquid/liquid dispersions
- Maaß*,1), S. Wollny2), A. Voigt3), M. Kraume1)
1) Chair of Chemical and Process Engineering / TU Berlin, Straße des 17. Juni 135, Sekr. MA 5-7, 10623 Berlin, Germany; phone: 0049-30-314-23171
2) Department of Fluid Mechanics / Anhalt University of Applied Sciences, Germany
3) Department of Chemical Engineering / University “Otto-von-Guericke” Magdeburg, Germany
*corresponding author: sebastian.maass@tu-berlin.de
Abstract
An online measurement technique for drop size distribution in stirred tank reactors is needed but has not yet been developed. Different approaches, different techniques have been published as the new standard during the last decade. Three of them (focus beam reflectance measurement, 2 dimensional optical reflectance measurement techniques and a fiber optical FBR-sensor) are tested and their results are compared with trustful image analysis results from an in-situ microscope.
The measurement of drop sizes in liquid/liquid distribution is a major challenge for all tested measurement probes and none provides exact results for the tested system of pure toluene/water compared to an endoscope. Not only the size analysis but also the change of the size over time gives unreasonable results. The influence of the power input on the drop size distribution was the only reasonable observation in this study. The FBR-sensor was not applicable at all to the used system. While all three probes are based on laser back scattering, the general question of the usability of this principle for measuring evolving drop size distributions in liquid/liquid system is asked. The exterior smooth surface of droplets in such systems is leading to strong errors in the measurement of the size of the drops. That leads to widely divergent results. A different measurement principle should be used for online measurements of drop size distributions than laser back scattering.
Keywords: particle size analysis, liquid/liquid dispersion, drop size distribution, measurement technique
1 Introduction
Liquid-liquid dispersions in stirred vessels or mixers are often used technical applications in the chemical, pharmaceutical, mining, petroleum and food industry. For controlling and optimizing these systems exact knowledge about the drop size distribution and its transient behavior under changes of energy input, temperature or composition is of major importance. Current mathematical descriptions of dispersion properties like the drop size distribution (DSD) as a function of process and physical parameters in an inhomogeneous flow field are still inaccurate. With more accurate models it would be much easier and cheaper to design and set up such reactors. The DSD describes the interfacial area, which is often the limiting factor for the mass transfer, a key parameter for industrial systems and scale up. But scale up on the base of theoretical assumptions is not possible without reliable and consequently validated models. In conclusion sizing of particles in industrial processes is of great technical interest and therefore techniques have been developed, based on different physical principles.
The difficulty in the use of stirred vessels is that the turbulence in the vessel is not very well characterized since it is not only inhomogeneous throughout the vessel, but it is highly anisotropic consisting of high shear regions on the surface of the impeller. Today many different techniques for sizing transient drop behavior in such vessels are available. Some work in-situ but a lot of them analyze by withdrawing samples over time (Bae and Tavlarides 1989; Bürkholz and Polke 1984; Desnoyer et al. 2003; Hay et al. 1998; Hurlburt and Hanratty 2002), which are later diluted or stabilized, prior to their measurements. These sampling techniques neither guarantee that the drop sizes are frozen, nor that they are preserved during the sampling (Martinez-Bazan et al. 1999; Pacek et al. 1994). In the following work we want to focus on inline measurement techniques for sizing drops in liquid/liquid dispersions.
Simmons et al. (2000) tested two optical laser-based dropsize measurement techniques, an offline diffraction technique and an inline back scattering technique. They have been tested with glass beads of a known size. Both techniques were found to be suitable for the measurement of liquid-liquid dispersions in pipe flows, but they are limited to different concentration ranges. The diffraction technique is limited to dispersed phase concentrations below 3% by volume, while the backscatter technique operated satisfactorily only at concentrations above 5%. Based on this promising results, the use of laser back scattering probes for different applications like sizing cell cultures (McDonald et al. 2001), nucleation or crystallization processes (Barrett and Glennon 2002) increased. The technique of Focused Beam Reflectance Measurement (FBRM) became very well-suited for in situ particle characterization. Heath et al. (2002) compared the FBRM to conventional particle sizing techniques (laser diffraction and electrical sensing zone) for a range of sieved aluminum or calcite suspensions. The mode average of the square weighted chord length was found to be comparable to other sizing techniques. However, FBRM measurements are not easy to interpret, because the measured chord-length distribution (CLD) is different from any type of particle size distribution (PSD) (Kail et al. 2009). Methods are discussed to transform the measured chord length distribution into a size (diameter) distribution (Li and Wilkinson 2005; Worlitschek et al. 2005; Yu et al. 2008).
For a spherical drop chord lengths are generally shorter than the real drop diameter and so the chord length distribution is wider then the originally one. While the laser beam crosses each chord randomly, the number of times a given chord length is measured takes the form of a probability density function. Stochastically models have been developed and published for transformation of CLD’s into DSD’s under the assumption of perfect spherical particles. For a broader overview see especially the work of Hu et al. (2006). Large errors were found between calculated DSD’s from CLD’s and measured DSD’s (Greaves et al. 2008; Tadayyon and Rohani 1998; Yu et al. 2008).
A large community of users successfully applies FBRM technology for monitoring, fault detection, and quality control of dynamic solid-liquid or gas-liquid processes. Greaves et al. (2008) applied it to emulsions and ice and clathrate hydrate formation processes. The accuracy of the FBRM has been explored by a direct comparison with a visual method. Therefore a particle video microscope (PVM) probe was used. It was found that while the FBRM can successfully identify system changes, certain inaccuracies exist in the chord length distributions. Particularly, the FBRM was found to undersize droplets in an emulsion and was unable to measure full agglomerate sizes. The onset of ice and hydrate nucleation and growth were successfully detected by the FBRM. Also Boxall et al. (2010) analyzed water drop sizes in crude oil emulsions with a PVM and an FBRM probe for a variety of oils spanning over two orders of magnitude in viscosity and for varying shear rates. The droplet size was shown to be dramatically undersized by the FBRM probe, even taking into account that it measures chord lengths rather than actual sizes. An empirical fit was found to give reasonable agreement between the FBRM and PVM mean sizes measured for droplets with an average error less than 20%.
Cull et al. (2002) and Lovick et al. (2005) employed an 3D optical reflectance measurement (ORM) technique, similar in operation to the FBRM and the 2D optical reflectance measurement in a liquid-liquid biocatalytic reactor.
Direct photography of liquid-liquid dispersions remains a trustful technique for measuring drop size distributions. It has been compared to capillary techniques (Pacek and Nienow 1995), external sampling with stabilized emulsions (O’Rourke and MacLoughlin 2005) and became a standard for testing the reliability of other measurement devices (Andrès et al. 1996; Greaves et al. 2008; Hu et al. 2006). In the following work the focus beam reflectance measurement, the 2 dimensional optical reflectance measurement and Fiber Optical Sensor will be used for the comparative experiments. These laser based online techniques will be evaluated with image analysis results. However the aim of this publication is to test promising measurement techniques for drop size distributions to find a tool which allows online particle sizing, a necessary base for drop size control.
2 Experimental apparatus and procedure
2.1 Measurement Technique: Laser systems
Laser methods can be subdivided into three main groups, based on their specific operating principle (Fraunhofer diffraction, spatial filtering and laser back scattering). Generally, all are very fast and so able to be used online. The most common method is laser back scattering which is the basic principle for all presented probes in this study.
2.1.1 2 Dimensional Optical Reflectance Measurement technique
The 2D ORM technique (2 Dimensional Optical Reflectance Measurement techniques) used in this study has a variation of the aforementioned laser backscattering technique with an ECA 010 sensor. It uses an optical reflectance measurement technique (ORM) of an intensive laser light beam to obtain the arc chord lengths of emulsion droplets in close vicinity of an optical window at the end of the sensor tube (see Fig. 1).
Using a special focused laser beam which can be manipulated so that only a very singular 2D layer of the emulsion stays in the focus of the light where the laser spot is rotating with very high-speed on a circular pattern over the emulsion. The data for the arc length lA of the droplet are measured. The chord length and the arc length of a droplet are related by:
| .
dS – diameter of the scanning laser circle |
(1) |
With additional mathematical transformation algorithms the chord length distribution can be transformed into a droplet size distribution. The 2D-ORM technique is especially suited for high density emulsions as the droplet sizes are estimated by back reflection in close vicinity to the sensor window (Fricke et al. 2007). A very large number of drops, a magnitude of several thousands, are analyzed by the probe. This large number should ensure that the maximum drop size, which is equal to the maximum chord length measured, has been captured. A drawback of this technique is the size of the probe (diameter = 30.0 mm) in relation to lab scale geometry.
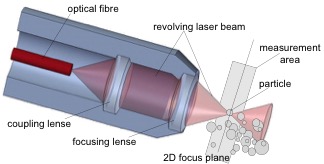
Fig. 1 – Droplet measurement set-up of the 2D-ORM sensor with 3D working principle.
2.1.2 Fiber Optical FBR-Sensor
The physical principle of the FBR-Sensor (forward-backward-ratio sensor) is based on the analysis of the spatial intensity pattern of light scattered into the forward and backward direction, which becomes significant for particles outside the Rayleigh scattering regime. This means spherical particles whose radius is below approximately one-tenth of the wavelength of the incident radiation (van de Hulst 1981). With increasing diameter an increased asymmetry between forward and backward scattering can be observed due to the pronounced diffraction lobe. The ratio of light intensities scattered in both directions can be used to invert the mean size of a particle ensemble. Depending on the sensor configuration and the type of light source, a size range from 50 nm to 200 µm can be detected (Sachweh et al. 1998). The design of the fiber optical FBR-Sensor, with a probe diameter of less than five mm, is shown in figure Fig. 2 (a). Three optical fibers are positioned with an angular spacing of 60°. One is used for illumination and the other two are used to detect scattered light at angels of 60° and 120° with a receiving half angle of 10°. With this set-up a measuring volume of 1 ml is obtained. The scattering intensities can be superimposed and a mean particle size can be derived from the intensity ratio from 60° and 120° by using the Mie theory (Chylek et al. 1978). Here the sample is screened by horizontal and vertically polarized light of different wavelengths. The size of the drops can be extrapolated by comparison of the scattered light intensities in the two polarization planes.
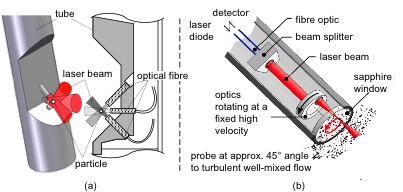
Fig. 2 – (a) Design of the fiber optical FBR-Sensor: 3D-Drawing of the tip of the probe (left) and cross section of the probe (right); (b) FBRM probe (Ruf et al. 2000) using light back scattering effects for drop sizing.
2.1.3 Focus beam reflectance measurement
Another in-situ laser based measurement technique which uses light back scattering effects is the Focused Beam Reflectance Method (FBRM) (Ruf et al. 2000). The principle of the cylindrical FBRM probe is shown in Fig. 2 (b). The optic rotates at a high velocity and focuses the laser beam near to the sapphire window. Passing particles backscatter the laser beam so that the chord length of the particle is computed by multiplying the scanning time with the beam speed. Usually, thousands of chord lengths are measured each second. This allows determining a robust chord length distribution, which can be used to illustrate changes in particle dimension, particle population and particle shape in time.
All laser techniques used in this article determine characteristic chord length distributions (CLD). Therefore the backscattered pulse from the laser probe is measured in the focus plane from one edge of the particle to an opposing edge. In the first approximation, the chord length of a scanned particle lC can be accounted for by lC = vS∙ΔtS. Here ΔtS is the time of flight for a pulse. The proportionality constant in this equation is vS, the velocity of the scanning focal point.
2.2 Measurement Technique: Endoscope Technique
Another major type of measurement techniques sizing drops in-situ are photo based methods working with image recognition. This method gives accurate values for the drop sizes in the analyzed system which are reliable and accurate (Hu et al. 2006; Pacek et al. 1994). The endoscope results are used as the “standard” with which the other probes are compared.
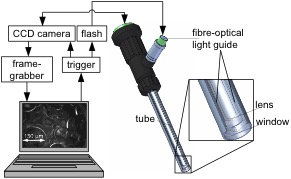
Fig. 3 – Detail 3D drawing of the endoscope probe and general set-up.
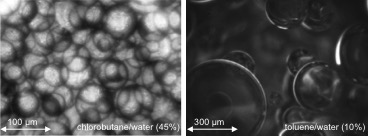
Fig. 4 – Example images, representing samples taken with the endoscope technique using different lenses according to the expected particle size for two different liquid/liquid systems.
The images are taken intrusively from inside the vessel by placing a 7 mm thick endoscope in front of a CCD camera as a microscope lens (see Fig. 3). To avoid disturbances by drops in front of the focal plane a covering tube with a window is placed at the tip of the endoscope lens. A strobe flash is guided by a fiber optic cable surrounding the endoscope to ensure sharp pictures even in vicinity of the stirrer (Ritter and Kraume 2000). The drops are semi-automatically measured and counted at a pace around 500 drops an hour. The technique is capable of measuring drops from 5 to 5000 μm even at high dispersed phase fraction (see Fig. 4).
2.3 Stirred tank
The same experimental set-up (T = 150 mm with torospherical bottom, Rushton turbine with Po = 3.8; for other dimensions see Fig. 5 and table 2) was used for all four in-situ probes during the variation of the stirrer speed from 400 to 700 rpm. All probes have been tested with the system toluene/water (recommended as standard test system for liquid/liquid analysis (Misek et al. 1985)) at pH 7. The used toluene (99.998 % purity) and the de-ionized water are almost indissoluble in the opposing phase. Toluene was used as dispersed phase with a fraction φ of 20 percent. The refractive index n is of major importance for the use of optical principles. Toluene/water was chosen because it has a comfortable refractive index of 1.496 at a temperature of 20°C. The other chemical properties of the system are listed in table 1.
table 1 – Listing of the data on used toluene/water system.
| at 20°C | refractive index n at 20°C | at 20°C | at 20°C |
| 36 | 1.496 | 870 | 0.55 |
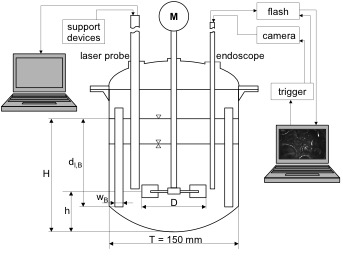
Fig. 5 – Experimental set-up stirred tank with two measurement probes.
table 2 – Dimensions and characteristics of the used stirred tank.
| T | H | dl, B | wB | h | D | Po |
| 150 mm | T | 0.8 T | 0.08 T | 0.33 T | 0.33 T | 3.8 (-) |
2.4 Measurement Procedure
The probes were introduced into the tank close to the stirrer at the same position to eliminate influence of the local position. As shown in Fig. 5, always one laser probe was tested together with the endoscope. Transient drop size distributions were measured for each parameter combination for about one hour. The Sauter mean diameter (d32 = S di3/Sdi2) is calculated out of the measured distribution. The particle diameter di is replaced with the chord length lc for the calculation of the Sauter mean diameter resulting from the focus beam reflectance measurement system.
The used standard is the endoscope system. It was checked and then tested for sensitivity to the number of counted particles to ensure reliable results. For verification a glass spheres/water suspension with known particle size distribution was used. This distribution was determined earlier, using a microscope over a plane with well-known distance. The satisfying comparison results for a monodisperse and a bimodal distribution are published by Ritter and Kraume (2000).
In Fig. 6 the Sauter mean diameter and the cumulative standard deviation in percent of the maximum particle diameter are shown over the number of counted drops. It can be seen that the d32 becomes constant after 250 counted drops. Although the cumulative standard deviation is decreasing, the cumulative Sauter mean diameter stays constant. This result is especially clear for the highest stirrer speed of 700 rpm (blue diamonds). The Sauter mean diameter of 250 drops reaches a value of around 311 µm. 200 drops later the cumulative d32 changed to 310 µm. Parallel the cumulative standard deviation σcum dropped down from 2.5 to 1.8 percent. Therefore a minimum number of 300 counted particles were used in this study for every single distribution.
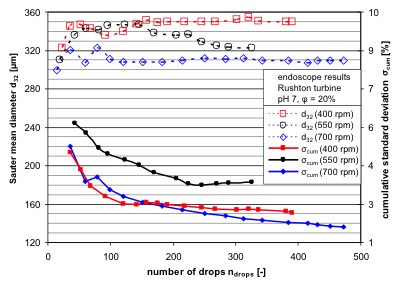
Fig. 6 – Cumulative Sauter mean diameter d32 over the number of counted drops and resulting cumulative standard deviation of developing d32.
3 Results and discussion
For many processes, not only the mean diameter but also the width and the shape of the particle distributions are of major importance for the product. Only three of the four measurement techniques, used in this study, provide information about the whole distribution. The 2 dimensional optical reflectance measurement techniques, the focus beam reflectance measurement and the endoscope are used to investigate the drop size distribution of the introduced system.
3.1 Drop size distributions
Results for drop size distributions are presented in Fig. 7. Here the cumulative number distributions Q0 at the steady state for all three measurement techniques always for the three stirrer speeds of 400, 550 and 700 rpm is shown. The steady state is definitely achieved after 25 min stirring for the low stirrer speed, so all distributions are taken from that time point.
Comparing the results it is obvious that all techniques achieve different drop size distributions, while analyzing the same system. The trustful image analysis results show drop diameter between 30 up to 600 µm. These values are ten times larger then the results occurring from the FBRM or even 15 times larger then the results from the 2D-ORM. Therefore the particle diameter is logarithmic plotted. Yet this axial allocation does not provide clear results of the particle diameter distributions for different stirrer speeds. The increasing energy dissipation with the increasing stirrer speed shows only explicit smaller drops for the endoscope technique but not for the two laser probes.
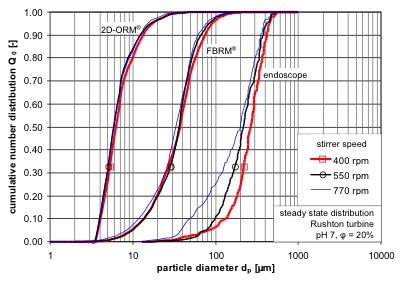
Fig. 7 – Comparison of the cumulative number distributions Q0 of toluene in water for three stirrer speeds after 25 min stirring (steady state). The results have been achieved by using three different measurement techniques 2D-ORM, FBRM and endoscope with image analysis.
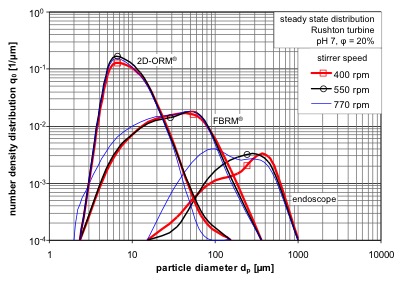
Fig. 8 – Number density distributions q0 for three stirrer speeds after 25 min stirring (steady state). The results have been achieved by using three different measurement techniques.
The double logarithmic plot in Fig. 8 is necessary because of the strong variation of the width of the number density distributions q0 resulting from the different measurement techniques. The narrowest, produced by the 2 dimensional optical reflectance measurement techniques, create the highest values for q0. Quite natural the widest distributions, produced by the endoscope, induce the lowest values for q0. The results of the focus beam reflectance measurement are between the other two techniques for both attributes.
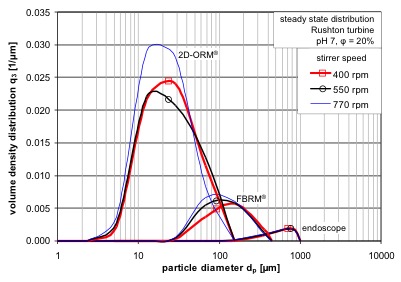
Fig. 9 – Volume density distributions q3 of toluene in water for three different stirrer speeds after 25 min stirring (steady state). The results have been achieved by using the three different measurement techniques 2D-ORM, FBRM and endoscope with image analysis.
The closer look on the effect of the stirrer speed on the drop size distribution shows again the clearest results for the endoscope. With increasing stirrer speed the drop sizes are decreasing. The maximum value for q0 is shifting to smaller drops. For the FBRM this behavior could only be found for the 700 rpm, the distributions for the low and the medium stirrer speed are almost the same. The results for the 2D-ORM are hard to differentiate. Only a decrease in the number of large particles for the 700 rpm could be observed. This means a lower number of counted drops for particle diameter in the range of around hundred micrometers, because these particle sizes are the largest drops measured with the 2D-ORM. For a better differentiation the q0 are now transformed in q3. The presentation of the achieved data plotted in Fig. 9 as a volume density distribution allows now a differentiation of the three stirrer speeds curves from the 2 dimensional optical reflectance measurement techniques. This is also the recommended representation by the producer of the 2D-ORM. The reason is obvious. Now it is distinguishable that the distribution is shifted to smaller particles with increasing stirrer speed. The same is observable for the results of the focus beam reflectance measurement. While the endoscope embraces the widest range of particle diameters the absolute values for the q3 are the lowest. So it is not possible to distinguish between the different endoscope results for the three stirrer speed in one plot with the other two measurement techniques. A closer look would be necessary but was already taken in Fig. 8. Interestingly both probes using laser back scattering show drop size results in the same range of the former used application – see Fricke et al. (2007) and Wollny et al. (2008). This occurs because of the dependency of the measurements on the focal position already reported by Heath et al. 2002. Especially the capturing of larger particle seems very sensitive on the focal position. In contrast the capturing of fine particles is insensitive to the focal point. These uncertainties are reflected in the wide range of the measured particle size.
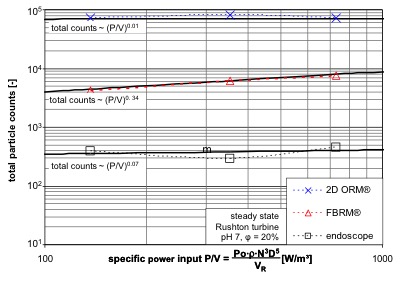
Fig. 10 – Total particle counts of 2D-ORM, FBRM and endoscope technique used to generate the distribution at the steady state.
A major advantage of the laser probes are the high number of particle counts per time unit. With a magnitude of several thousands analyzed drops by the probe the capturing of the maximum drop size which is equal to the maximum chord length should be ensured. The results in Fig. 7, Fig. 8 and Fig. 9 show obviously, that that aim is not fulfilled. Still the number of counts as a function of the system parameters is a very interesting information to interpret the configuration. Therefore the drop counts are analyzed as a function of the energy dissipation P/V in Fig. 10. Obviously the number of counts is tremendously higher for the laser probes then for the commonly used photographic sampling technique with the endoscope. These low numbers of analyzed drops is due to the enormous time consuming work of image analysis. The minimum number for statistic relevant results (300 drops) is always accomplished.
The two laser probes show a clear difference in the number of counts and in the characterization of the counts over the energy dissipation. The data achieved with the FBRM show a clear increase of the particle counts with an increase of the energy dissipation. The constant volume of the organic phase is dispersed more with increasing energy dissipation, so the particle size is decreasing and therewith the number of particles is increasing with a proportionality of (P/V)0.34. The absolute numbers for the FBRM are about a factor of ten smaller then the absolute numbers for the 2D-ORM. Both probes are counting the bypassing drops over five seconds. This time delta can be changed by the user for shorter or longer integrations. The 2 dimensional optical reflectance measurement techniques doesn’t capture the maximum drop diameter even with the higher number of drop counts. The development over an increasing power input is increasing as for the FBRM but with a much lower proportionality of (P/V)0.01, which means the counts are almost constant. Therefore only the FBRM gives interpretable data.
3.2 Sauter mean diameter
The results for the evolving Sauter mean diameter obtained by the endoscope measurements are shown in Fig. 11 for three different stirrer speeds over time. The results reflect the physical behavior of the system: With higher stirrer speeds smaller drops are achieved. Also the time dependency is reasonable: At longer stirring time smaller drops occur until the breaking and coalescing phenomena reach steady state, which is definitely achieved after 25 min stirring.
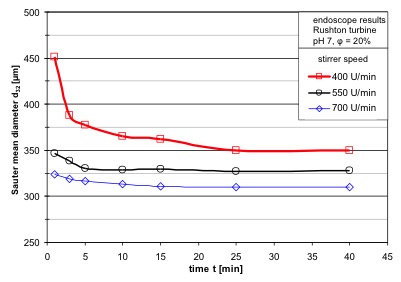
Fig. 11 – Transient Sauter mean diameter at three different stirrer speeds (endoscope measurements).
In Fig. 12 the results of the endoscope for a stirrer speed of 400 rpm, also presented in Fig. 11, are compared with the results of the other used measurement techniques until a steady state is reached. Two major results are obvious. Firstly, both rotating laser probes measure much smaller drop sizes than the endoscope and the FBR‑Sensor. Secondly, it can be seen that besides the endoscope no measurement technique indicates the clear transient behavior with decreasing drop sizes of the system. The FBR‑Sensor shows even an increase of drop sizes with an increase of stirring time.
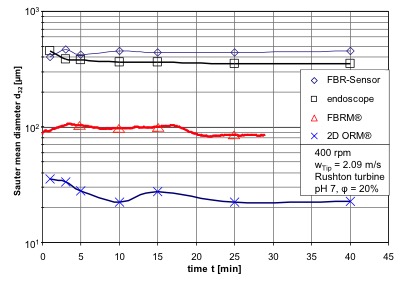
Fig. 12 – Comparison of the resulting transient Sauter mean diameter of the four investigated measurement techniques at constant stirrer speed.
While the transient results were not satisfying, the steady state Sauter mean diameter for different power inputs has been compared in Fig. 13. Every parameter stayed constant except the stirrer speed and therewith the power input.
The results of the FBR-Sensor are again close to the values of the endoscope but they do not reflect the change of the power input. The values generated from the measuring signal stayed nearly constant. Many different set-ups were used to adapt the FBR-Sensor to the used system of toluene and water but all attempts where without success. Only a suspension with a particle size smaller then 10 µm could be analyzed satisfactorily. This solid/liquid system of calcium carbonate (calcilit 4 –CaCO3) and water was mentioned for calibration by the producer.
For all dependencies of the steady state Sauter mean diameter over the power input, the proportionalities have been calculated. The results in Fig. 13 from endoscope are comparable with the results from Ritter (2002). The dependency he found for the system of toluene/water of the Sauter mean diameter on P/V was d32 ~ P/V-0.08 (p. 86, (Ritter 2002)) for φ = 0.125. The higher dispersed phase fraction in this study leads to a slightly lower exponent of P/V which was generally also reported by Kraume et al. (2004). Higher values of φ are leading to higher coalescence rates and therewith to a lower dependency on the power input.
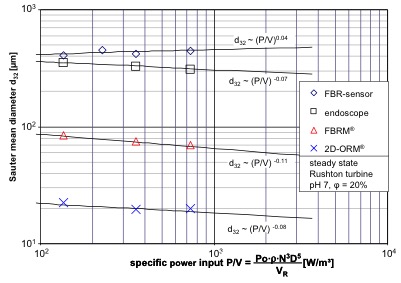
Fig. 13 – Comparison of the steady state Sauter mean diameter for three different power inputs by varying the stirrer speed for the four used measurement techniques.
The 2D-ORM and the endoscope technique show nearly the same proportionally of the Sauter mean diameter over power input. So it should be possible to use the 2D-ORM probe in liquid/liquid dispersions to analyze and control the change of DSD for different power inputs.
Also the focus beam reflectance measurement shows physical meaning full behavior. For higher energy dissipation rates the mean drop size is decreasing. The exponent of P/V with -0.11 is stronger then the exponent resulting from the image analysis. Such proportionalities and even higher values in a toluene/water system have been reported by Gäbler et al. (2006) at a pH 3. So it seems that the results from the FBRM do roughly reflect the influence of P/V on the steady state Sauter mean diameter. It has already been presented in literature that the deviations of the FBRM to image analysis results are reproducible and can be correlated with a linear relation (Wollny et al. 2008).
The drop sizes measured with the FBRM and the 2D-ORM are definitely too small. This results from the exterior smooth surface of drops as opposed to solid particles. The reflection of the laser beam from such surfaces is not diffuse over the whole surface area but punctuated. Independent from the size of the drops only three points of the surface reflect the laser light back to the probe (see Fig. 14). This effect was proven with a single particle experiment; moreover the dependency of the drop size distribution on particle shape and optical properties of the focus beam reflectance measurement has already been reported by Li et al. (2005). They compared the FBRM-technique with three alternative sizing techniques and concluded a complex dependency of the measured sizes with the properties of the system (Li et al. 2005).
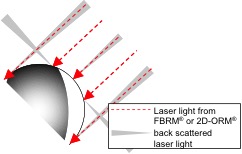
Fig. 14 – Functional drawing of the back scattered laser light by exterior smooth surfaces, to be found in pure liquid/liquid – systems like toluene/water.
In pure systems like used in this study, one drop scatters the laser light back to the probe as three separated beams. Therefore, the measured chord length is too small and the number of measured particles is too high. For ceramic spheres of comparable size with a rougher surface, both measurement techniques achieve higher values for the particle size (see also the reports of Greaves et al. (2008)). An alternative for solid particles is the increasing of the roughness of the drop surface. The deviation between the endoscope and the FBRM were decreasing for experiments with surfactants, which are changing the shape of the drops (but also the physical properties).
There is still a lack of understanding of the influence of particle surface on the results obtained with laser backscattering. An experiment with varying optical properties of the drop surface by introducing Titanium dioxide (TiO2) particles into the system was carried out. TiO2 is insoluble in water and the mono disperse particles with a diameter of around 10 µm accumulate at the toluene/water interface. Solid particles which are present on the interface of drops reducing the rate of drop coalescence (Binks 2002, Fournier et al. 2009). The intensity of the influence is depending on the particle concentration. While no decrease of coalescence is requested only 14.87 mg of TiO2 have been introduced into the system. As reported by Binks (2002), particles do not affect the interfacial tension. Interfacial tension measurements with the ring method carried out in our lab, supporting that assumption. The transient Sauter mean diameters observed with endoscope and focus beam reflectance measurement are compared for the same parameter set with and without added TiO2 particles in Fig. 15.
The d32 measured with the endoscope shows no influence of the Titan dioxide concentration in the investigated measurement range. They look almost the same plotted with a logarithmic ordinate. The exact opposite is identifiable for the FBRM-technique. The absolute values of the drop sizes are increased. The steady state Sauter mean diameter, this is accomplished after 25 minutes stirring, is two times larger with Titanium dioxide particles as without (d32;TiO2/d32 = 2.14). Additionally a clear transient behavior is notable. The increasing time of stirring leads now also with the FBRM to decreasing drop sizes until the equilibrium between breakage and coalescence is achieved.
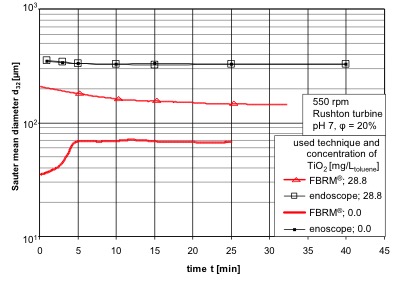
Fig. 15 – Comparison of transient Sauter mean diameter under the influence of TiO2 achieved with the endoscope technique and the FBRM.
4 Conclusion
Comparative experiments between a photo based endoscope technique and three laser techniques (FBR-sensor, 2D-ORM and FBRM) have been carried out to determine an exact online measurement technique for drop size distributions. The endoscope has been used as a standard which against the other techniques compete.
It is clearly shown, that the measurement of drop sizes in liquid/liquid distribution is a major challenge for all tested measurement probes and none provides exact results for the tested system of pure toluene/water. Differencing the free laser probes, the worst results were observed from the FBR-sensor. It was not applicable at all to the used system. The influence of the power input on the drop sizes showed reasonable results for the FBRM and the 2D-ORM. The same proportionally range of the Sauter mean diameter over power input for the image analysis results and both probes, the focus beam reflectance measurement and the 2 dimensional optical reflectance measurement techniques, was observed. So it is possible to use them in liquid/liquid dispersions to analyze and control the change of DSD for different stirrer speeds. Both probes gave unreasonable results over time for a constant stirrer speed and are thereby no online probes for such liquid/liquid dispersions (see table 3 for a short summary). While all three probes are based on laser back scattering, the general question of the usability of this principle for measuring drop size distributions in liquid/liquid system is asked. The exterior smooth surface of droplets in such systems is leading to strong errors in the measurement of the size of the drops. That leads to widely divergent results. This effect of the kind of the surface is analyzed in detail by adding micro-particles to the system. The produced synthetic roughness of the drop surface is leading to much more reasonable results of the FBRM-probe. Still the absolute values are divergent from the image analysis results. A different measurement principle has to be used for online measurements of drop size distributions than laser back scattering.
Boxall et al. 2010; Cull et al. 2002; Gäbler et al. 2006; Heath et al. 2002; Kraume et al. 2004; Lovick et al. 2005; Simmons et al. 2000
table 3 – Summary of the parameters and results of the four different techniques for the decision process.
| requirements | 2D-ORM | FBRM | FBR-sensor | endoscope |
| in – situ | + | + | + | + |
| online | + | + | + | – |
| local analysis | + | + | + | + |
| probe diameter | 30 mm | 25 mm | 4 mm | 6-15 mm |
| measurement range (µm) | 1-1000 | 1-1000 | 1-300 | 5-5000 |
| output quantity | DSD/CLD | CLD | mean particle diameter | DSD |
| quantitative results for the water/toluene system | no transient analysis possible, right tendencies with wrong absolute values (two decades deviation) | no transient analysis possible, right tendencies with wrong absolute values (one decade deviation) | not useable for the applied system | useable as standard method for exact results |
S y m b o l s
D – stirrer diameter (m)
d32 – Sauter mean diameter (m)
dl,B – immersion depth of baffles (m)
dP – particle diameter (m)
dMax – maximum measurable particle diameter (m)
H – liquid level of the tank (m)
h – distance between stirrer and tank bottom (m)
lC – Chord length (m)
N – stirrer speed (rpm)
n – refractive index (-)
P/V – power input (W/m³)
Po – power number
Q0 – cumulative number distribution (-)
q0 – number density distribution (1/m)
q3 – volume density distribution (1/m)
T – tank diameter (m)
t – temperature (°C)
tS – scanning time of one particle (s)
vS – scanning velocity of the laser focal point (m/s)
wB – width of baffles (m)
wTip – tip velocity of the stirrer (m/s)
γ – interfacial tension (mN/m)
η – dynamic viscosity (mPa∙s)
ρ – density (kg/m³)
σ – standard deviation (%)
φ – dispersed phase fraction (-)
Abbreviations
CLD – chord length distribution
DSD – drop size distribution
FBR – forward-backward-ratio
FBRM – focus beam reflectance measurement
fps – frames per second
ORM – optical reflectance measurement
PSD – particle size distribution
Acknowledegements
We gratefully acknowledge the financial support from the Bayer Technology Services GmbH and especially Dr. Joachim Ritter, who gave the basic ideas for this research.
REFERENCES
Andrès, C., Réginault, P., Rochat, M.H., Chaillot, B. and Pourcelot, Y. (1996). Particle-size distribution of a powder: Comparison of three analytical techniques. Int. J. Pharm. , 144(2): 141-146.
Bae, J.H. and Tavlarides, L.L. (1989). Laser Capillary Spectrophotometry for Drop-Size Concentration Measurements. AIChE J., 35(7): 1073-1084.
Barrett, P. and Glennon, B. (2002). Characterizing the metastable zone width and solubility curve using lasentec FBRM and PVM. Chem. Eng. Res. Des., 80(A7): 799-805.
Binks, B.P. (2002). Particles as surfactants – similarities and differences. Curr. Opin. Colloid Interface Sci., 7(1-2): 21-41.
Boxall, J.A., Koh, C.A., Sloan, E.D., Sum, A.K. and Wu, D.T. (2010). Measurement and Calibration of Droplet Size Distributions in Water-in-Oil Emulsions by Particle Video Microscope and a Focused Beam Reflectance Method. Ind. Eng. Chem. Res., 49(3): 1412-1418.
Bürkholz, A. and Polke, R. (1984). Laser Diffraction Spectrometers / Experience in Particle Size Analysis. Part. Charact., 1: 153-160.
Chylek, P., Kiehl, J.T. and Ko, M.K.W. (1978). Narrow Resonance Structure in Mie Scattering Characteristics. Appl. Opt., 17(19): 3019-3021.
Cull, S.G., Lovick, J.W., Lye, G.J. and Angeli, P. (2002). Scale-down studies on the hydrodynamics of two-liquid phase biocatalytic reactors. Bioprocess. Biosyst. Eng., 25(3): 143-153.
Desnoyer, C., Masbernat, O. and Gourdon, C. (2003). Experimental study of drop size distributions at high phase ratio in liquid-liquid dispersions. Chem. Eng. Sci., 58(7): 1353-1363.
Fournier, C.O., Fradette, L. and Tanguy, P.A. (2009). Effect of dispersed phase viscosity on solid-stabilized emulsions. Chem. Eng. Res. Des., 87(4A): 499-506.
Fricke, M., Voigt, A. and Sundmacher, K., 2007, Droplet size distribution of technical Macroemulsions: Variation of Process Parameters, In: Proceedings of Int. Cong. Part. Tech., Nuremberg, 27.-29.03., 4 pp.
Gäbler, A., Wegener, M., Paschedag, A.R. and Kraume, M. (2006). The effect of pH on experimental and simulation results of transient drop size distributions in stirred liquid-liquid dispersions. Chem. Eng. Sci., 61(9): 3018-3024.
Greaves, D., Boxall, J., Mulligan, J., Montesi, A., Creek, J., Sloan, E.D. and Koh, C.A. (2008). Measuring the particle size of a known distribution using the focused beam reflectance measurement technique. Chem. Eng. Sci., 63(22): 5410-5419.
Hay, K.J., Liu, Z.C. and Hanratty, T.J. (1998). A backlighted imaging technique for particle size measurements in two-phase flows. Exp. Fluids, 25(3): 226-232.
Heath, A.R., Fawell, P.D., Bahri, P.A. and Swift, J.D. (2002). Estimating Average Particle Size by Focused Beam Reflectance Measurement (FBRM). Part. Part. Sys. Char., 19(2): 84-95.
Hu, B., Angeli, P., Matar, O.K., Lawrence, C.J. and Hewitt, G.F. (2006). Evaluation of drop size distribution from chord length measurements. AIChE J., 52(3): 931-939.
Hurlburt, E.T. and Hanratty, T.J. (2002). Measurement of drop size in horizontal annular flow with the immersion method. Exp. Fluids, 32(6): 692-699.
Kail, N., Marquardt, W. and Briesen, H. (2009). Process Analysis by Means of Focused Beam Reflectance Measurements. Ind. Eng. Chem. Res., 48(6): 2936-2946.
Kraume, M., Gäbler, A. and Schulze, K. (2004). Influence of physical properties on drop size distributions of stirred liquid-liquid dispersions. Chem. Eng. Technol., 27(3): 330-334.
Li, M.Z. and Wilkinson, D. (2005). Determination of non-spherical particle size distribution from chord length measurements. Part 1: Theoretical analysis. Chem. Eng. Sci., 60(12): 3251-3265.
Li, M.Z., Wilkinson, D. and Patchigolla, K. (2005). Comparison of Particle Size Distributions Measured Using Different Techniques. Part. Sci. Technol. , 23(3): 265 – 284
Lovick, J., Mouza, A.A., Paras, S.V., Lye, G.J. and Angeli, P. (2005). Drop size distribution in highly concentrated liquid-liquid dispersions using a light back scattering method. J. Chem. Tech. Biotech., 80(5): 545-552.
Martinez-Bazan, C., Montanes, J.L. and Lasheras, J.C. (1999). On the breakup of an air bubble injected into a fully developed turbulent flow. Part 1. Breakup frequency. J. Fluid Mech., 401: 157-182.
McDonald, K.A., Jackman, A.P. and Hurst, S. (2001). Characterization of plant suspension cultures using the focused beam reflectance technique. Biotechnol. Lett., 23(4): 317-324.
Misek, T., Berger, R. and Schröter, J. (1985). Standard Test Systems for Liquid Extraction. EFCE Publications, Series 43 (2nd edition).
O’Rourke, A.M. and MacLoughlin, P.F. (2005). A comparison of measurement techniques used in the analysis of evolving liquid-liquid dispersions. Chem. Eng. Process., 44(8): 885-894.
Pacek, A.W., Moore, I.P.T., Nienow, A.W. and Calabrese, R.V. (1994). Video Technique for Measuring Dynamics of Liquid-Liquid Dispersion during Phase Inversion. AIChE J., 40(12): 1940-1949.
Pacek, A.W. and Nienow, A.W. (1995). Measurement of Drop Size Distribution in Concentrated Liquid-Liquid Dispersions – Video and Capillary Techniques. Chem. Eng. Res. Des., 73(A5): 512-518.
Ritter, J., 2002. Dispergierung und Phasentrennung in gerührten Flüssig/flüssig-Systemen. phd Thesis, Technische Universität Berlin, 169 pp. (in German).
Ritter, J. and Kraume, M. (2000). On-line measurement technique for drop size distributions in liquid/liquid systems at high dispersed phase fractions. Chem. Eng. Technol., 23(7): 579-582.
Ruf, A., Worlitschek, J. and Mazzotti, M. (2000). Modeling and experimental analysis of PSD measurements through FBRM. Part. Part. Sys. Char., 17(4): 167-179.
Sachweh, B., Heffels, C., Polke, R. and Rädle, M., 1998, Light scattering sensor for in-line measurements of mean particle sizes in suspensions, In: Proceedings of 7th Europ. Symp. Part. Char., Nuremberg, 635-644
Simmons, M.J.H., Zaidi, S.H. and Azzopardi, B.J. (2000). Comparison of laser-based drop-size measurement techniques and their application to dispersed liquid-liquid pipe flow. Opt. Eng., 39(2): 505-509.
Tadayyon, A. and Rohani, S. (1998). Determination of particle size distribution by Par-Tec (R) 100: Modeling and experimental results. Part. Part. Sys. Char., 15(3): 127-135.
van de Hulst, H.C., 1981. Light Scattering by Small Particles – Structure of Matter Series. Dover Publications, New York, 470 pp.
Wollny, S., Sperling, R., Heun, G., Ritter, J., Maaß, S. and Kraume, M., 2008, Bestimmung von Tropfengrößenverteilungen zur Charakterisierung von Rührorganen hinsichtlich der Partikelbeanspruchung, In: Proceedings of ProcessNet Partikelmesstechnik, München, 10.-14.03., 2 pp. (in German)
Worlitschek, J., Hocker, T. and Mazzotti, M. (2005). Restoration of PSD from chord length distribution data using the method of projections onto convex sets. Part. Part. Sys. Char., 22(2): 81-98.
Yu, Z.Q., Chow, P.S. and Tan, R.B.H. (2008). Interpretation of Focused Beam Reflectance Measurement (FBRM) Data via Simulated Crystallization. Org. Process Res. Dev., 12(4): 646-654.
- By Sebastian Maas
Leave a Reply